Cart 0
How To Analyse Your Shot Data
Table of Contents
Welcome to the Shot Analysis section of the guide. In this article, we’ll explain how to access the Shot Analysis via the Steady Aim app, the different metrics that are recorded with the device, and how to interpret them to get better results during your training.
How to Access and Use the Shot Analysis Feature #
To access the Shot Analysis feature for each of your shots, follow the steps below:
- Navigate to the Shoot tab found on the Home screen.
- Fill in the required details for your shooting session and complete however many shots you’d like for your training session.
- All your shots will be listed on the Shoot screen. To view the data for each shot, simply tap on the shot you’d like to view. The app will direct you to another screen, which will give you a visual representation of your shot.
- Navigate to the drop-down button at the bottom of the screen to select which phase of the shot you’d like to view.
Now that you know how to view the breakdown of your shot, it’s time to learn how to interpret the data to improve your technique and accuracy.
Steadiness Score #
In order to improve your accuracy, one of the first metrics you need to focus on is your steadiness.
Steadiness is an indication of the tremor movement the archer sees in their sight. The steadier you are as an archer, the more your accuracy will improve.
To assess your steadiness and determine if this is an area you need to work on, there are two metrics on the app you’ll need to pay attention to:
Steadiness Score for each shot and Average Steadiness Score.
The Steadiness Score can be found on the Shoot screen and on the Shot Analysis screen for each shot. The Average Steadiness Score can be found at the top of the Shoot screen under the target type and bow profile.
The Steadiness Score is a numeric representation of how steady an archer is while shooting. The score is out of 100 and is based on the g-forces or acceleration passing through the bow.
The Average Steadiness Score is the average score of all your shots during a single session.
Higher scores indicate a steadier archer, therefore if your scores are low in this area, you’ll need to assess your technique, or bow setup, to see where you can improve.
For reference, international-level archers usually achieve around 92/100 with Compound Bows and 90/100 with Recurve Bows.
Potential reasons for a low steadiness score include:
- Your draw length is too short
- You are not shooting fit
- You are experiencing target panic
- You’re holding too long
- Cams are marginally out of time
Drift Score #
Drift is the archer’s drifting movement of their sight picture.
To assess how much you drift during your shots, there are two metrics you need to pay attention to:
Drift Score and Average Drift Score
The Drift Score can be found on the Shoot screen and on the Shot Analysis screen for each shot. The Average Drift Score can be found at the top of the Shoot screen under the Average Steadiness Score.
The Drift Score is also a score out of 100 and is based on the size of the Hold Ring at the point of release. The Average Drift Score is the average Drift Score of all your shots in a single session.
Higher Drift Scores indicate less movement all over the target. Therefore, if your score is low, your bow is drifting too much across the target and impeding your ability to shoot accurately.
For reference, international-level archers usually score around 94/100 with Compound Bows and 92/100 with Recurve Bows.
Potential reasons for a low Drift Score include:
- Your draw length is too long
- Cams are excessively out of time
- Your bow stabilisation is too light
- You are not shooting fit
- You are holding too long
- Your stabilisers are too flexible for the amount of weight added to them.
- There was movement before the release
Please note, there are several other factors that may work concurrently or exclusively to contribute to low Steadiness and Drift Scores. The data from the Steady Aim system is intended to be used holistically therefore, the archers’ environment must be considered when interpreting the data to get a complete picture. If you’d like an in-depth analysis of each of your shots, navigate to the Shot Analysis screen to view the Shot Analysis traces for each phase of your shot.
Our Steady Aim system uses our proprietary algorithm to measure Steadiness and Drift Scores, which gives you a snapshot of how you or your athlete is performing for each shot and session. You can also compare your scores for each shot and session to track your progress or compare your scores to other Steady Aim users.
Cant Angle #
The Cant Angle is the angle of the bow at the time of release. It is measured from a zero-degree reference point when the bow is perfectly vertical. This metric allows you to see whether you are tipping the bow to the left or right of the reference point and is one of the most crucial metrics you can track as an archer as it causes the biggest group spread across the target face.
The Shot Analysis #
The Shot Analysis section of the app is one of the most crucial features as it allows you to view the breakdown of your shot.
You can choose to view all traces at once for an overview of your shot or you can filter by phase to view each trace separately. The traces allow you to analyse each phase of your shot and determine where your technique or bow setup needs improvement.
Each shot has the following traces you can view:
- Set up
- Hold
- Follow Through
- Execution
Set-Up #
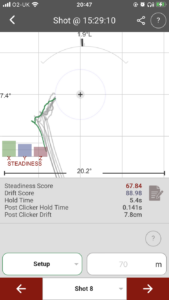
The Set-Up phase of the Shot Analysis is a graphical representation of how you draw the bow before a shot. This section of the Shot Analysis can be used to determine if you are consistently setting up your shot in the same manner.
Hold #
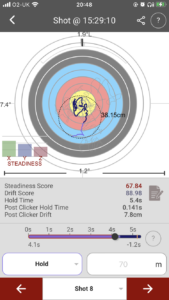
The Hold phase shows your entire hold pattern for the shot, which is comprised of two phases. The first phase shows your sight movement within three degrees of the point of release. The second phase, which is the darker blue line, is the aim portion of the phase and represents the last second before the release.
Additionally, this phase allows you to compare the hold patterns of your previous shots in the same session and to view different time windows during the Hold pattern that is most relevant to your shooting style.
The Hold phase also provides a graphical representation of your Hold Ring. The Hold ring gives you an indication of the theoretical group size based on your sight picture at that precise time. When you enter a shooting distance at the start of the session, the Hold Ring will show the diameter of the group in perfect conditions.
Follow Through and Execution #
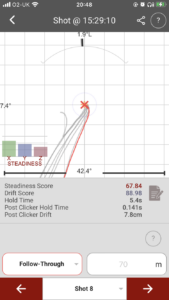
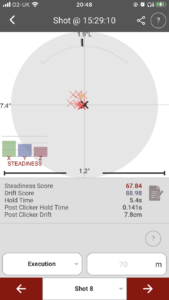
The Follow Through and Execution section of the shot analysis gives you a graphical representation of the “Shot Efficiency”.
The black X represents the point of release and the red X represents the moment the arrow leaves the bow.
Under perfect circumstances, there would be no movement of the bow during the time it takes the arrow to leave the bow. In this scenario, the two crosses will be synchronous. Therefore, the more movement there is during the release and the moment the arrow leaves the bow, the less synchronous the two Xs will be.
You can use the gap between the two Xs to assess how well you or your athlete executed the shot and how you drop, bump, pull, or push the shot on release.


Powered by BetterDocs